pdfplots
レンダリング結果
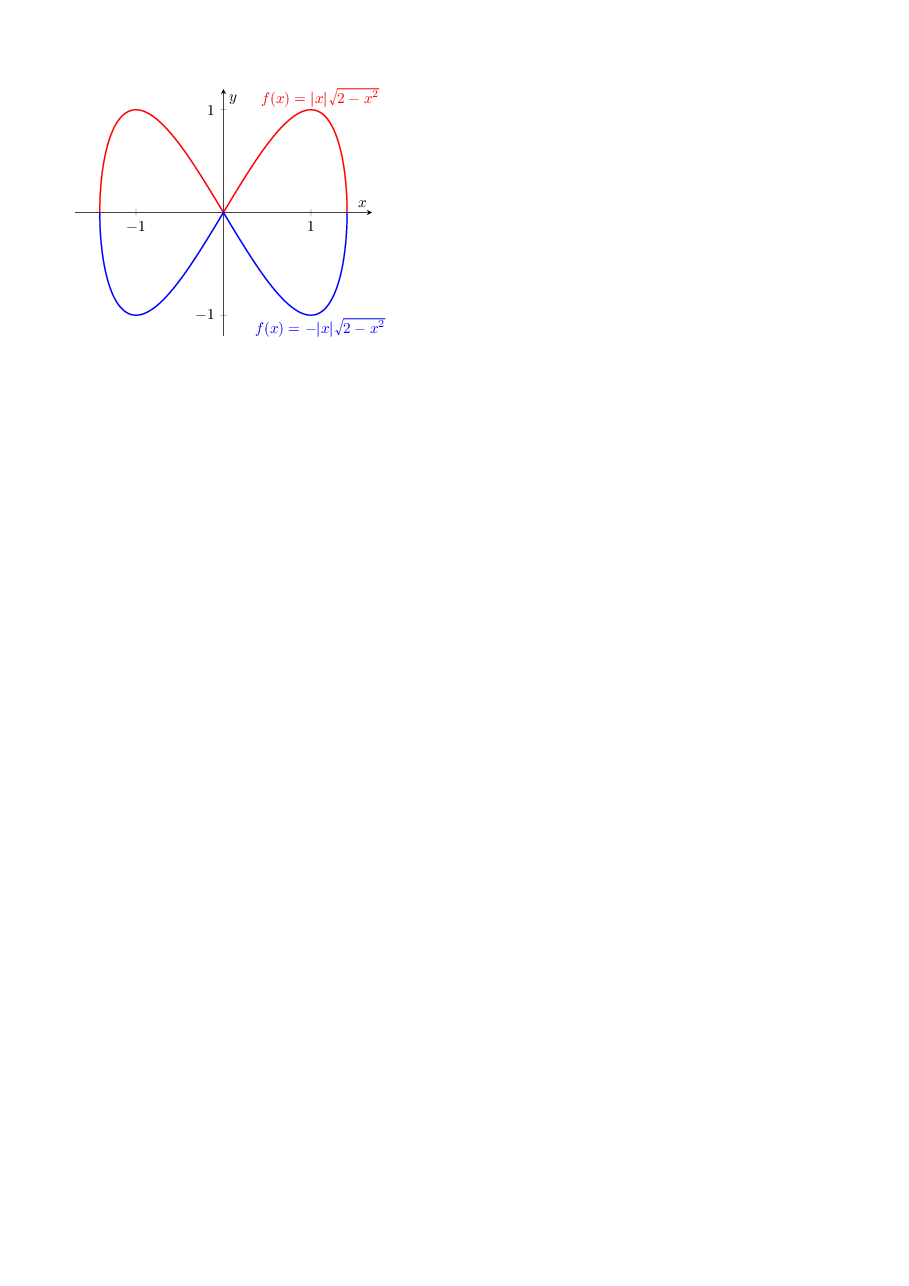
TeXソース
TeXソース
入力コード
\documentclass{tetsujsarticle}
\usepackage{tetsuryoku}
\begin{document}
\begin{tikzpicture}
\begin{axis}[
    domain=-pi/2:pi/2, % The range over which to evaluate the functions
    xtick={-1,...,1}, ytick={-1,...,1}, % Tick marks only on integers between -1 and 1
    axis lines=middle, % Axis lines go through (0,0)
    enlargelimits=true, % Make the axis lines a bit longer than required for the plots
    samples=101, % Number of samples for evaluating the functions (use an odd number to capture the (0,0) point
    xlabel=$x$, ylabel=$y$, % Axis labels
    clip=false % So the labels aren't cut off
]
\addplot [thick, red]
    ( {sqrt(2) * sin(deg(x))},
      {abs(sin(deg(x*2)))} )
    node [pos=0.8, anchor=south] {$f(x) = |x|\sqrt{2-x^2}$}; % Add a text node at 80% of the plot length
\addplot [thick, blue]
    ( {sqrt(2) * sin(deg(x))},
      {-abs(sin(deg(x*2)))} )
    node [pos=0.8, anchor=north] {$f(x) = -|x|\sqrt{2-x^2}$};

\end{axis}
\end{tikzpicture}
\end{document}